Normal distribution (also known as standard distribution) simply refers to one of the most prevalent data patterns, where the most commonly-occurring value is in the middle of the graph and then the frequency tapers off at either extreme end. For example, if you are looking at home prices in an area, there will be a lot of homes around the average price, which is somewhere in the middle of the graph. Then, as you look for homes that are cheaper and cheaper, or more pricier and pricier, there will be less and less homes available as you go lower or higher in price. In other words, your graph might look something like this:
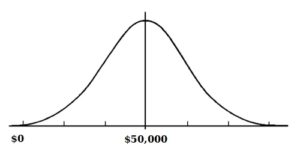

As you can imagine, this type of pattern (where the most commonly-occurring value is in the middle and then they taper off as you get to either extreme) is true of lots of data sets: human height, 1-mile run times, the list goes on and on. Because of how often you see this pattern, that is why it is worth studying.
Now, the key to understanding how it works is to remember that the following points about a normal distribution graph are always true:
- The mean (average) value of the group is always right in the middle, at 50%.
- The percentages & number of standard deviations separating each “chunk” are always exactly as shown below. (Note: For an explanation of standard deviations, see our other post HERE)
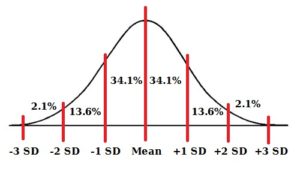
This fact that the graph always follows this pattern and percentages means that if you’re dealing with a normal distribution and you have only a few details, it is really easy to figure out the missing pieces!
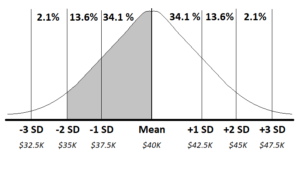
Since the standard deviations is $2,500, that means $35,000 is -2 deviations away from $40,000. You can then add the “chunks” that represent each deviation (34.1% + 13.6% = 47.7%) to get the total percentage that falls within that range.
- Draw out the base model
- Shade in the “chunk(s)” the problem is asking you about
- Plug in what you know
- Easily calculate everything else!
Why Our Study Guides Work
Learning the material is just the first step. You need a way to refresh yourself on the content because there is so much to remember.
We created our signature study guides to help you quickly and easily review everything you've learned:
Focus on the right things
We condense every chapter to a few pages each, so you can focus on what you need to know.
Understand the key concepts
We provide extra examples & bonus materials to help you understand the trickier concepts.
See how it all relates
Our outlines are super organized and make it easy to see how the concepts relate to each other.
Get Your CPCU 500 Study Materials NOW!
Looking for our printables-only package? Click here.

About your instructor
Insurance Exam Guides (IEG) was founded by Stacy Trinh, CPCU®, who first started her teaching journey at the request of her co-workers who were preparing for their CPCU exams. Because of her reputation as an adept trainer and motivator, Stacy's co-workers had asked her to lead a class. The feedback on her sessions and study materials was overwhelming positive, and her students encouraged her to share what she had to offer with the rest of the CPCU community.
Since then, Stacy created a library of study materials for both CPCU® and AINS® that have helped thousands of students pass their exams. As an accounting major and former claims adjuster, her style of instruction incorporates both a financial and operational perspective that makes her study materials well-rounded. She looks forward to helping many more students continue to succeed, including you!
Disclaimers: The Institutes, CPCU®, and AINS® are trademarks of the American Institute For Chartered Property Casualty Underwriters, d/b/a The Institutes. InsuranceExamGuides.com is not affiliated or associated with The Institutes in any way, and The Institutes do not endorse, approve, support, or otherwise recognize InsuranceExamGuides.com or its products or services. CPCU® and AINS® are registered trademarks of The Institutes. All rights reserved.